
Climate Sensitivity: The Most Contestable Number
It attracts argument because it can be argued, not because it determines urgency.

By Dean Rovang
Staying Curious · justdean.substack.com · ORCID 0009-0006-1351-5320
Suppose the argument were settled tomorrow and equilibrium climate sensitivity turned out to be three degrees per doubling rather than four. Would anything about what we ought to do change?
I want to argue that the answer is very nearly no, and that this is worth stating plainly, because the volume of attention the question absorbs suggests that a good many people believe otherwise. If a reader’s sense of urgency rises and falls with where that estimate lands, then something has gone wrong in how the case was made — and those of us making it share the responsibility.
There is a reason this particular quantity attracts the argument. You cannot argue with 425 parts per million. You cannot argue with 1.4 degrees of observed warming, or with the residence time of carbon dioxide in the atmosphere being measured in millennia. Those are measurements. Equilibrium climate sensitivity is a derived quantity with a genuinely wide range and several defensible methods that disagree with one another. The range has stayed wide for forty years, and the instrumental record is not the kind of evidence that closes it. It is the softest spot in an otherwise hard set of numbers, and argument flows to soft spots — from both directions, by people who have decided in advance that the mainstream estimate is set too low, or too high, to suit their purposes.
What follows is an attempt to say what the number does and does not decide, using published model runs rather than assertion.
The state of the estimate
AR6 assessed a best estimate of 3 °C, with a likely range of 2.5 to 4 and a very likely range of 2 to 5, drawing on process understanding, the historical record and paleoclimate together. Several recent results have pulled at that assessment from both directions.
Hansen and colleagues (2023) put equilibrium sensitivity at 4.8 ± 1.2 °C, derived largely from the glacial-to-interglacial transition, with ice-sheet albedo change treated as a forcing rather than a feedback.
Cooper and colleagues (2024) went to the same glacial record and applied a correction that Hansen does not — the pattern effect, the fact that the geographic distribution of warming changes the strength of the feedbacks acting on it. Correcting the Last Glacial Maximum for that effect reduced the range to 2.1 to 4.1 °C.
Myhre and colleagues (2025) came at it from the present rather than the past. The observed trend in Earth’s energy imbalance from 2001 to 2023 is not reproduced by the low-sensitivity CMIP6 models, particularly in the separate longwave and shortwave components, which argues against the bottom of the range.
Bimpiri, Hocking and Mauritsen (2026) re-examined the same observations using full model ensembles rather than one realisation each, and read them differently. The magnitude of the imbalance is matched well by models with sensitivity between 3 and 5 °C; every observed annual value, including the record 1.8 watts per square metre in 2023, falls inside the model range once the ensembles are used. The trend shortfall they attribute more plausibly to internal variability or misapplied forcing than to underestimated sensitivity, on the grounds that the models capture the magnitude while missing the trend.
Set those side by side and the overlap is narrower than the argument suggests. Cooper’s 2.1 to 4.1 and Bimpiri’s 3 to 5 intersect between 3 and 4.1. AR6’s likely range lies across it. Hansen’s central value sits just outside the top. Most of the serious disagreement is therefore between about 3 and about 4 — which is the interval the rest of this piece examines.
What one degree of sensitivity looks like
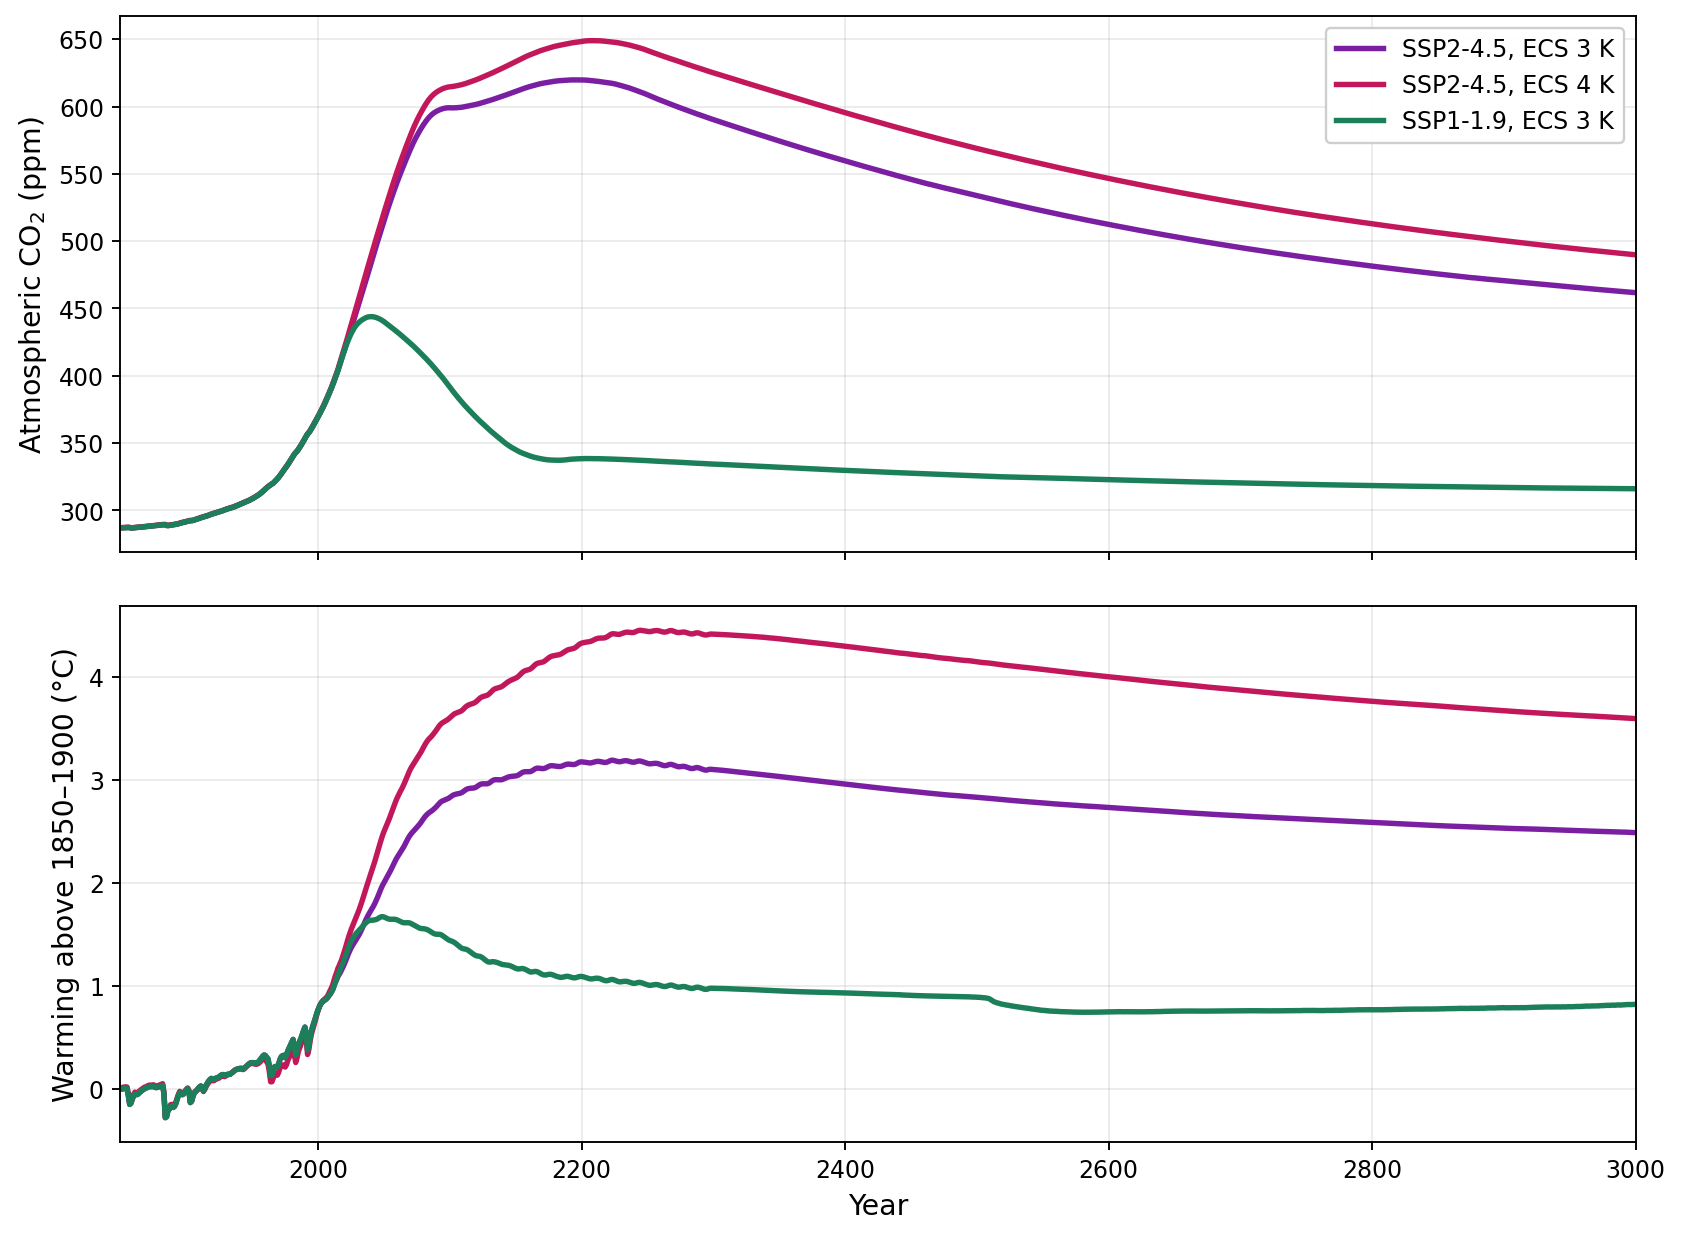
Global carbon dioxide and temperature for two emission pathways at two climate sensitivities. CLIMBER-X, emission-driven with an interactive carbon cycle, vegetation and ice sheets (Rockström et al. 2026, Earth’s Future, CC BY 4.0; data Zenodo 10.5281/zenodo.19696770). No SSP1-1.9 run at 4 K was published.
Rockström and colleagues published a set of runs this summer that make the question concrete: the same emission scenario at two different sensitivities, carried to the year 3000 in a model with an interactive carbon cycle, interactive vegetation and ice sheets rather than prescribed ones.
The first thing to note is at the left of the figure, and it is the reason I plot the data. Across the entire instrumental record the two runs are indistinguishable. At 1900 they differ by nine thousandths of a degree, at 1950 by seven thousandths, at 2000 by seven thousandths. They reach 0.18 °C apart in 2025 and separate from there. The historical record does not contain the information needed to choose between them, because the difference has not happened yet.
Second, higher sensitivity raises the carbon dioxide as well as the temperature. The same emissions in a warmer world meet weaker sinks, leaving roughly 35 parts per million more in the air by 2300. A concentration-driven experiment cannot show this at all, because the concentration is imposed.
Third — and this is what the argument turns on — there is only one line for SSP1-1.9, the strong mitigation pathway. No four-degree version was published. I will come back to why.
The same runs on different axes
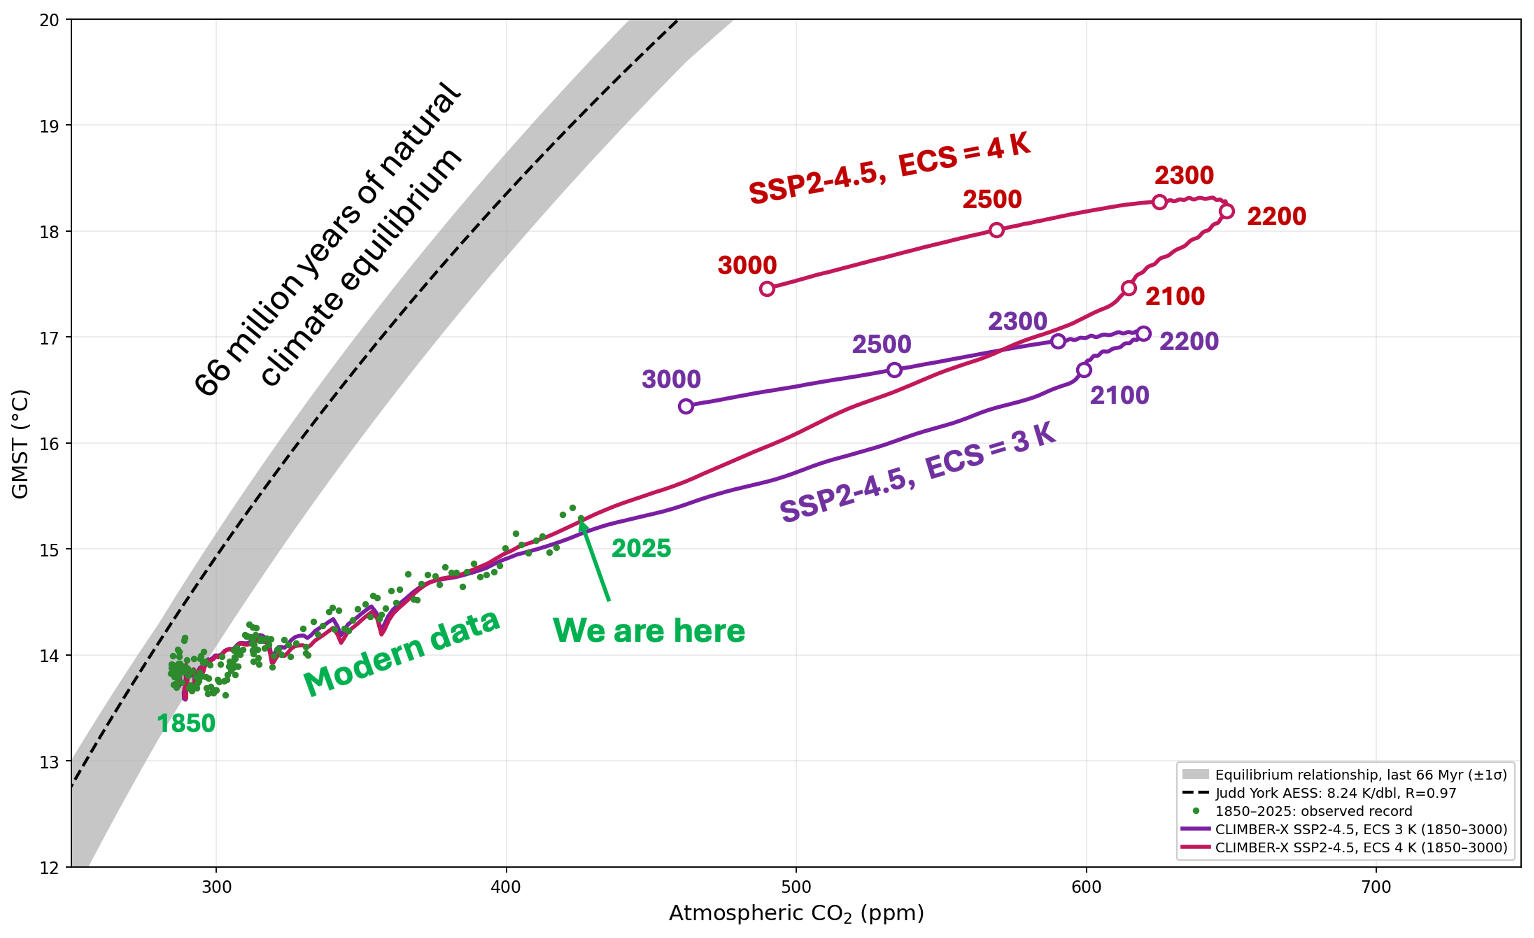
The same SSP2-4.5 runs plotted against each other rather than against time. Grey: the relationship between carbon dioxide and global mean surface temperature over the last 66 million years, from four independent reconstructions. Green: the observed record, 1850 to 2025. Temperature here is total warming plotted against carbon dioxide alone, ignoring the role of other greenhouse gases and forcings, so a slope read off these axes is not a climate sensitivity.
Plotting temperature against carbon dioxide rather than against time puts the modern excursion beside the relationship the two variables held for the last 66 million years. The grey band is that relationship; the green dots are the instrumental record.
Two features are worth reading off it. The two sensitivity runs leave the observed record together and only separate well beyond it — the same point the time series makes, now in a form where the departure from the long-term relationship is also visible. And both runs sit far below the band throughout: raising sensitivity by a full degree per doubling moves the trajectory only marginally toward it, and neither has closed much of the distance by the year 3000. Whatever the sensitivity turns out to be, these trajectories are not returning to that relationship on any timescale worth naming.
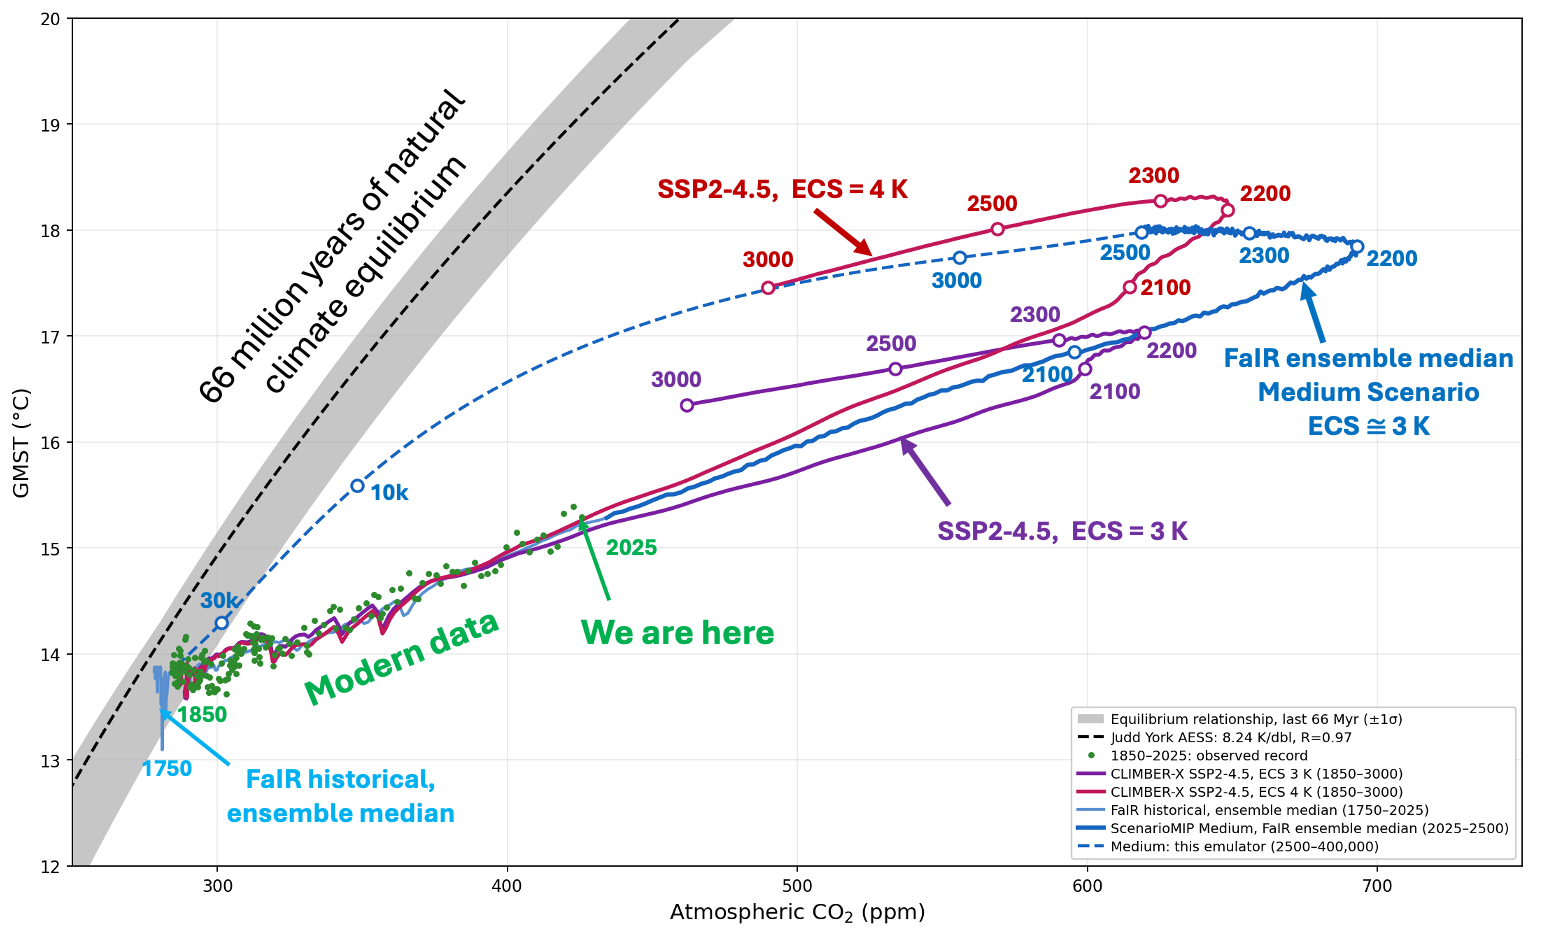
The same, with two additions. Light and dark blue are the same model — FaIR, run emission-driven so its carbon dioxide is computed rather than prescribed — historical to 2025 and then the Medium pathway of the coming ScenarioMIP round (van Vuuren et al. 2026, GMD 19, 2627) to 2500, with a simple emulator beyond. FaIR has no single climate sensitivity here: each line is the median of an 841-member ensemble calibrated to the AR6 assessed range, whose median sits near three degrees per doubling, which is why it sits close to the CLIMBER-X reference run.
Two more lines. The light blue is a historical run driven by emissions rather than concentrations, which is why it sits slightly right of the observed record — its carbon cycle accumulates a little more carbon than the atmosphere actually did, while its temperature tracks observations closely. The horizontal displacement is a carbon-cycle diagnostic that a temperature time series cannot show at all.
The darker blue is the Medium pathway of the coming ScenarioMIP round (van Vuuren et al. 2026, Geoscientific Model Development 19, 2627), which counts only policies actually implemented and is therefore approximately what current policy delivers, together with a simple model’s estimate of the eventual return. It carries more carbon than SSP2-4.5 and sits further right accordingly.
Where the sensitivity question matters
Here is the answer to the missing run, and it needs no new computation. Warming is sensitivity multiplied by sustained forcing. Mitigation removes the forcing, so there is nothing left for sensitivity to multiply. On a pathway that reaches net zero and then draws carbon down, the difference between three and four degrees per doubling shrinks toward nothing, because the term it multiplies is going to nothing. On a pathway that keeps emitting, it compounds.
That is what the first figure shows. Through the end of this century the two SSP2-4.5 runs differ by about six tenths of a degree. It is only over the following two centuries, while that pathway goes on holding carbon in the air, that the gap opens to 1.3 °C.
Climate sensitivity is therefore not a fixed stake being argued over. It is a stake whose size is set by how much carbon is left in the air and for how long. It matters most precisely where mitigation fails, and hardly at all where it succeeds. Applied to the seven pathways of the coming assessment round, that means it matters materially for two of them — Medium and High, the ones that go on emitting — and barely at all for the five that mitigate.
Which is presumably why Rockström and colleagues ran SSP2-4.5 at both sensitivities and SSP1-1.9 at only one. On a trajectory that returns toward preindustrial concentrations within a few centuries the sensitivity chosen barely changes the answer, and a modelling group with a finite compute budget will spend it where it makes a difference.
One further point, which the first figure makes and a table of peak values would not. The separation between the two sensitivities is not a transient excursion. At three degrees per doubling the SSP2-4.5 run is 3.10 °C above preindustrial in 2300 and still 2.49 in 3000; at four degrees it is 4.42 and 3.60. A degree of sensitivity is worth a degree sustained across a millennium, not a degree at a peak.
It is worth naming what those two pathways have in common, because it is not a coincidence. The scenarios where sensitivity makes the largest difference are the ones that keep emitting longest, and those are also the ones that leave the most carbon in the air for the longest time. Both follow from the same thing. Sustained forcing is what gives sensitivity something to multiply, and sustained forcing is what sets how long the disturbance lasts.
That puts the two uncertainties in proportion. On a pathway that keeps emitting, the sensitivity question is worth about a degree and a third — the gap between the two runs in the first figure, which is 1.3 °C at 2300 and still 1.3 at 2500. The duration question — how long that carbon remains and the warmth with it — is measured in thousands of years, and it is very nearly independent of where sensitivity lands, because it is governed by how quickly the carbon leaves rather than by how much warming each part per million produces.
The quantity being argued over is bounded by roughly a degree. The quantity that is not being argued over is measured in millennia.
The low end of the range is already sufficient
There is a standing objection that climate models run hot. It is not merely rhetorical: Hausfather and colleagues published on precisely this in Nature in 2022, showing that some CMIP6 models sit above the assessed range and arguing they should be weighted accordingly. The field identified the problem and corrected for it.
Which is worth holding against the runs in this piece. Their reference case is three degrees per doubling — the assessed best estimate, not a high one, and below the point at which the hot-model objection begins to bite. That run puts SSP2-4.5 at 3.10 °C above preindustrial in 2300 and still 2.49 °C in the year 3000.
Nothing in that result depends on a high sensitivity. It is what the consensus value produces on a middle-of-the-road pathway: an outcome outside the range in which agriculture and settlement were established, held there for a millennium. The four-degree case is worse. It is not the case the argument needs.
What follows from this
The disagreement is real and it is narrower than its online version. Most of it now falls between about three and four degrees per doubling. Within that interval the question is worth four tenths of a degree at the end of this century on any pathway, and a degree or more by 2300 only where emissions continue.
There is one route by which sensitivity genuinely bears on urgency, and it should be stated rather than glossed. Sensitivity sets the remaining carbon budget: the higher it is, the less can still be emitted before a given temperature is reached. So it does bear on how fast, and a higher value is a legitimate argument for moving sooner.
Those two claims fit together more easily than they look. The reason to mitigate is not a target. It is the prospect of holding three or four degrees for thousands of years, and that prospect is present at every sensitivity in the range — which is why the decision to mitigate does not wait on the estimate. Once mitigation is under way, sensitivity does begin to matter, because on a pathway that comes back down a few tenths of a degree decides which side of a two-degree target you land on. But missing a target on a mitigated pathway and not mitigating at all are different orders of problem. The first costs a threshold. The second costs the millennia.
So a higher sensitivity makes an urgent situation more urgent. It does not make a comfortable situation urgent, because there is no value anywhere inside the plausible range that produces a comfortable situation. A reader whose urgency depends on which end of three-to-four the estimate settles at was reasoning from the wrong term.
Which is where I would end. If the case for acting rests on climate sensitivity, it rests on the one quantity in the field that is genuinely contestable — where several serious methods disagree, where the range has stayed wide for forty years, and where anyone wanting a different answer has room to push. The case does not rest there. It rests on the concentration, which is measured; on the observed warming, which is measured; on the residence time of the carbon, which is measured; and on the finding that even the coldest defensible sensitivity produces conditions outside the range in which agriculture, cities and every civilisation on record were established, and holds them there for centuries.
That the argument continues is not a problem. Science argues. That it is treated as though its outcome determines urgency is a failure of communication, and I include myself in that.
A part of the problem is us scientists. We use jargon no one understands, and we equivocate over insignificant details. The willful deniers and the head-in-the-sand deniers use our own language to convince the public that there is no problem.
We Are in the Anthropocene—Now What? Johan Rockström, , Stefan Rahmstorf
First published: 06 June 2026 https://doi.org/10.1029/2025EF007730
"The second point of concern, involving resilience, covers several potential surprises in the Earth system response to such warming: current Earth system models may lack or underestimate the strength of some important climate-related positive feedbacks under these high-temperature conditions. The warming response could be stronger than commonly anticipated. These cases are conceptually sketched as purple arrows in Figure 2. They are an attempt to address the open question to what extent the Earth system will conserve its Holocene resilience under human pressures. Put another way, to what degree will the Earth system continue to physically and biologically buffer Anthropocene stress (i.e., to which degree it continues to be constantly dominated by negative feedbacks to warming that either take energy out of the system (like the Planck radiation feedback) or greenhouse gases out of the atmosphere (like CO2 fertilization)?
"